Since I wasn’t too happy with the work-energy chapter from the textbook I was using for class, I wrote my own version. Here it is. It’s my first draft, so let me know if you find any errors.
Oh, also I had to leave out a bunch of fun stuff to prevent it from being too long. I should probably break it into two chapters and add some stuff.
Here is a collection of stuff I’ve found online. These could be nice for physics projects or homework or blog posts–but what do I know? I’m really tempted to post questions or physics ideas, but I won’t.
Feel free to use these or not use them. They are really for me. You’re welcome, Future-Rhett.
Video captured the moment a road buckled and sent a car flying as a heatwave impacted Missouri on Sunday.
Note: This is a series of posts with my favorite physics labs. These labs are intended for the algebra-based college level course (but clearly could be adapted for other courses). Feel free to use this in a way that makes you happy.
Objective
This is the first lab of the course, so the goal is two part:
Practice with measurements and uncertainty.
Practice making graphs (linear graphs)
The graph thing might seem silly, but students need work on this and it’s used in pretty much every lab for the semester.
Measurementsand Uncertainty
Here is my version of this whole thing. VERY SHORT.
We like to measure stuff in physics – however, we can never measure stuff perfectly. One way to account for error in measurements is to include an uncertainty. Suppose I measure a length, it could be reported as L = 0.13 +/- 0.01 meters. This says the length is most likely between 0.12 and 0.14 meters.
There are three ways to get this uncertainty.
Approximation. If you can only record a value once (or repeating won’t give you anything new) then the best option is to just be a human and assign a reasonable value. The uncertainty can’t be smaller than half the smallest division on your measuring device.
Standard deviation. If you can repeat the measurements, you can calculate the average and the standard deviation. The standard deviation would be the uncertainty. Note: make sure you get at least 5 values or you will just be kidding yourself.
Calculation. If you want to get the area of a table, you measure the length and width and then calculate the area. This means you will have to calculate the uncertainty also. You can do this with the “crank three times” method. Use your uncertainties to find the smallest and largest possible values. The uncertainty is then halfway between these values.
Here is a short lecture on measurements.
Now for some practice.
Take an aluminum block (or really any block). Find the volume and density with uncertainty.
Reaction time. Take a ruler and hold in vertically near another human’s fingers. Drop it and measure how far it falls before it is caught. Repeat 10 times, get the average and standard deviation.
Graphing
In physics, we like to build models. If the model is expressed as an equation, what better way to show the model is legit than to make a linear graph. OK, let’s just get to it. Here is a quick tutorial on graphing.
Now for some practice. Find a bunch of circular objects of different size (at least 4 different sizes). Measure both the circumference and diameter. Now create a plot of circumference (vertical axis) vs. diameter (horizontal axis) and find the slope. Recall that we have the following relationship:
“The circle is now complete. When I left you, I was but the learner. Now I am the master.”
That’s what Darth Vader said when he encountered Obi-Wan Kenobi in Star Wars Episode IV. This is how I feel about our Mathematical Methods course. I remember taking an undergraduate course AND a graduate version. I was clearly “but the learner”. Now, I am ready to be full master. I’m not even going to use a textbook (because none of them really fit the course).
Instead of a textbook, I’m going to list my topics for this course (along with any resources that I have). If you like, you can think of this blog post as my textbook. Oh, but it’s a living textbook. I’m going to modify this throughout the semester to match what’s going on in class.
OK, let’s get to it. Oh, most of these links are videos.
PHYSICS! Now that I have your attention, let’s go over the important points. I’m currently an associate professor of physics at a public university. But wait! That’s not all. I’m also a blogger at WIRED and Medium along with videos on youtube (Dot Physics). Oh, there’s Instagram too.
Oh, you want to reach me to ask a physics question or suggest a blog topic or share a cool video? Maybe you want me to give a talk (that’s possible) or media inquires or maybe some science (or sci-fi) consulting? Here’s my email: rhettallain AT gmail DOT com.
Photo: Rhett Allain. STEM Fest at Southeastern Louisiana University
It’s something the we do every once and a while. There will be some event for middle to high school students that has something to do with science. So, the department (Chemistry and Physics) will set up some type of demo stations for the kids. Usually some of our physics and chemistry majors are in charge of interacting with the younger kids. It’s a great opportunity for our majors.
But there are some demos that work well and some that don’t work so great. Recently we participated in STEM Fest. Basically a whole bunch of “vendors” set up tables for kids to come by and see science stuff (Science Technology Engineering Math). With that, you want a demo that can meet the following conditions:
Relatively easy to set up (no particle accelerators).
Visually attractive to normal humans. Something that could be seen from a distance that a person might say “hey, what’s that? Let’s check it out”.
Has some type of explanation that can at least START a discussion about science. Hopefully something that our chemistry and physics majors could use to engage in a conversation.
It would be nice if it could engage multiple (maybe like 5-10) kids at one time.
With that in mind, I want to go over the stuff we used (and some things I saw other tables using) and talk about how well they worked. In a future post (or multiple posts) I would like to give a more detailed description of each demo with key ideas for our students to use in when starting a conversation.
Liquid Nitrogen Balloons
Photo: Rhett Allain. Chemistry major pulling a balloon out of liquid nitrogen.
Fortunately, we often have left over liquid nitrogen in our department. This demo could be anything—but we normally take a bunch of balloons and stuff them into the cold liquid so that they shrink. When you pull them out, they expand. It’s very visual and quick to perform. You can also put some liquid nitrogen in a styrofoam cup and let student blow air onto it. This cause the cold air in the cup to move and make water vapor (plus they can feel it).
Overall, this is a pretty good demo. It was a big hit at STEM Fest. Really, the only bad thing is that you need liquid nitrogen. If you don’t have that, then you don’t have anything. In terms of setup, we did bring the large dewar of liquid nitrogen, so that’s a little bit of a pain—but the balloons are small and cheap.
Dry Ice Bubbles
Photo: Rhett Allain. Chemistry student making bubbles with dry ice.
I really didn’t pay too much attention to this demo. I think it’s a flask with dry ice connected to a tube with a funnel on the end. When you dip the funnel into soap, the expanding carbon dioxide fills the balloon. Simple.
This looks easy to setup, but it didn’t draw as big of a crowd as the liquid nitrogen. But it’s so easy to do that it seems like a nice one to include.
Concave Mirror
Photo: Rhett Allain. Concave mirror plus an LCD monitor without the polarization screen.
We have this large parabolic mirror. My intention was that kids could use this to project an image onto a piece of paper (I made a small frame to hold tracing paper). But you can also just look at it and see a real image of your hand (it looks like you can grab your own image).
This should always be included with demos. It’s super easy to set up. You just need to put it where people can see and they will often figure out their own demos to do with it. The screen projection didn’t really work—you need some type of very bright source to make a projection.
I would like to make one modification to this setup. If there was some kind of marker (like a ring stand) at the appropriate location for the viewing location, it would be easier to see how to grab your hand image. That seems easy to set up.
Polarized Light and an LCD Monitor
I have an older LCD monitor with a the front polarizer removed (a student did this for me a while ago). There’s a large (external) polarizer. When students hold this up, you can see the image on the monitor. Without the external polarizer, it’s just a white screen. Oh, I’m running an old Apple TV with a screen saver to produce an image.
Again, this is pretty easy to setup (assuming you have electrical power). It’s not super appealing from a large distance, but when kids get up close they seemed to enjoy it.
Chemistry Gak
I didn’t have anything to do with this demo (you know, chemistry). Basically, kids come by and mix together stuff to make gak (a type of fun putty or something). The kids like it, but they have to sit down for a moment to make the stuff. You could probably do about 3-4 students at a time.
You can’t really see this demo from far away. A human would have to decide to go up to the table to figure out what’s going on. Also, it requires a bunch of supplies to be carried into the event. However, in the end the kids get something to take away (the gak). We always do this one.
Vacuum Bag
We didn’t do this one, but I saw another group use it. The idea is to take a human and put them in a large plastic bag (with their head sticking out). Then you use a vacuum cleaner (or pump) to remove the air from the bag. The atmospheric air pressure then locks the person in place and they can’t move.
It’s a great demo, but not really for large crowds. It takes a few minutes for a person to work through the demo and other people can just observe. Also, it sort of scares me. A kid could get freaked out or have trouble breathing. Even worse, they might try this one on their own and do it wrong (and dangerous).
OK, there are more demos—but those are the ones we used recently. Next time we have an event, I will add any new stuff we used.
For my Intro Physics course (algebra-based), I created video summaries for each chapter. These are created to accompany College Physics (Giambattista 5th ed – McGraw Hill).
Here are the videos for the first semester (mechanics):
Note: This is for me and anyone else that needs remote physics lab data. My goal is to keep this as simple as possible.
What is a capacitor?
The very basic idea of a capacitor can be two parallel conducting plates with an insulator between them. It could literally just be two metal plates with air between them.
When a capacitor is connected in a circuit, negative charges move onto one of the plates, but they can’t jump to the other side because of the insulator gap. However, these charges DO create an electric field that can interact with the negative charges on the opposite plate. This pushes those charges off the plate such that it appears there is a continuous electric current. Also, with negative charges leaving that plate, it now becomes positive.
Remember that I is the direction of positive moving charges —but it’s almost always negative moving charges.
This build up of charge creates an electric potential difference from one plate to the other. The ratio of charge to voltage is defined as the capacitance.
Where Q is the charge on just one plate (since the total charge is zero) and C is the capacitance. If Q is measured in Coulombs and ΔV is in volts, then C is in units of Farads.
So, what happens when we connect this capacitor to a battery with a resistor? Here is a simulation.
I was going to write a bunch more stuff—but I apparently already did. Here is an older post on RC circuits.
Now I will just focus on this lab. Here is some experimental data (in the form of a video).
Here’s what to do.
Look at the part where the capacitor is charging. Collect data for the voltage across the capacitor as a function of time. More data is better—but don’t go crazy. If you can get a data point every 1 or 2 seconds, that should work.
Now make a plot of voltage (on vertical axis) vs. time (horizontal axis).
Repeat this for the discharging capacitor.
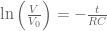
But what about a linear plot? For a capacitor (C) discharging through a resistor (R), the voltage should be:
This is not a linear equation. Divide both sides by V0 and take the natural log. This is what happens.
Now if you plot ln(V/V0) on the vertical axis and t on the horizontal axis—it should be a straight line. EVEN BETTER, the slope of this line means something. Use the graph to find the value of C if R = 150 Ohms.
Now go back to the other post. See if you can create a numerical model for a discharging capacitor. Here, this might help you get started.
Suppose you built your own capacitor and you wanted to discharge it. For this capacitor, you used two sheets of aluminum foil separated by a page in your textbook. The capacitance can be calculated as:
where
Use this to estimate the value of the capacitance. How long would it take to get halfway discharged using a 150 Ohm resistor? Could you essentially repeat this experiment with your homemade capacitor? Hint: no.
This is the lab that goes along with the first semester of the algebra-based physics lecture. That means the students are mostly biology majors, industrial technology, or engineering technology.
This semester, there were only about 13 students enrolled. Here is a link to the course webpage. Over the years, I have learned that you really can just focus on one or maybe two big ideas during the semester. This time, I focused on:
Modeling with graphs. Collect data. Make a linear graph. Find the slope and interpret it.
Measurement and uncertainty. OK, technically I just used this during the second half of the semester.
The Good.
I can’t remember the exact paper—but there was a research paper that said physics labs don’t really help students. Oh, I found it.
I feel like this gives me the freedom to do what I think will help the students the most. It doesn’t matter if I cover all the topics in the lecture. Yay.
With this in mind, I decided to start off with the marshmallow challenge. It’s basically a team-building and problem solving exercise in which groups try to create a structure to support a marshmallow as high as possible. I used this modified version – it’s great: https://shiftingphases.com/2019/07/08/hacking-marshmallow-challenge/
Other than that, here are some other things that worked well this semester:
Continued using end of class quizzes. Sometimes they seemed forced, but there were a couple of times that I made the quiz a sort of competition – like the projectile motion lab where they have to hit a target.
I think the numerical calculation lab went well. This could be better if I included the numerical stuff in more later labs. OK, technically it’s needed for the spring lab and the air resistance lab but normally students are too far behind to get to that part of the lab.
Finally, I cut down on the pre-lab instructions. Students weren’t reading them anyway. I tried short presentations – but I don’t think that really worked either.
The Bad:
Let’s just get to a list of notes here.
The thing that sticks in my mind is the extreme frustration I had with graphs. I feel like at the end of the semester, there were still many students that still didn’t understand graphing or the slope of a linear function. Help.
Lab reports were for the most part super terrible. Maybe I should just stop having them turn in a lab report.
The last lab of the semester, I asked them what they wanted to focus on. They said they were interested in a lab where they collect data on their phones (it was an idea I mentioned using the PhyPhox app). I went over some of the experiments, but I don’t think anyone really did anything.
The Future
Here are some ideas for the next time I teach this lab.
No more lab reports? Maybe move to some type of worksheet that the students turn in?
Maybe more learning activities – stuff like card sorts and speed dating physics problems?
More numerical calculations.
Go over the PhyPhox stuff and give them an explicit experiment.
What about using plickers at the beginning of class?